UX Case Study
Call Center Monitor App

The Client
Lili is a mobile bank designed for freelancers serving more than 150k customers. Lili’s Customer Service Center handles up to 30K inquiries each month.
This project was conducted as part of a UX course led by Tal Florentin. My partners were Olivia Dori and Shir Weil.
Overview
"Hands-on" Without hands
Our user is a Customer Service Center manager who wants to ensure the center is consistently operating at maximum efficiency. Since she cannot be at her office desktop during all business hours, she needs a mobile tool to monitor the operation while completing other tasks.
Our research has shown that Customer Service Center managers prefer to receive alerts on important issues so that they only have to look at the app when a problem arises.
With our Call Center Monitor App, Customer Service Center managers can be in control while out of the office.
Challenges
Select and Visualize The Right Data
Customer Service Centers measure virtually everything all the time. They keep track of the amount and type of tickets (calls, emails, chat messages), average and longest waiting time, handling time, agent statistics, most common reasons for contacting Customer Service Center, and much more.
Our main challenge was narrowing down all that data to the very few metrics that can give the Customer Service Center manager a good indication of what’s happening live.
Research
-
Investigating the client about the Customer Service Center
Our starting point was a long conversation with the client about the Customer Service Center and its daily operations. We asked about the room and the facilities, the people working there, and the company goals and Key Performance Indicators (KPIs) relevant for the Customer Service Center.
-
Distributing online surveys for Customer Service Agents
In an attempt to understand the daily operations of customer service agents, we have distributed online surveys for people who have worked in customer service centers. The information we received helped us understand the goals, struggles, and challenges of running a customer service center.
-
Conducting interviews with Senior Customer Service Center managers
As we expected, this was the longest and most meaningful part of the research. These conversations helped us “separate the wheat from the chaff” in deciding which metrics to include in the app and which are not necessary.
-
Researching similar ideas and products
We searched and studied the conventions and norms for data visualization in call centers and customer service centers.
-
User tastings and iterations
Our insights were turned into wireframes and then shared with experienced Customer Service Center managers. Their feedback helped us decide the most effective way to visualize the information to give our users all the knowledge they need as fast as possible. This was important considering that it is a mobile app to be used out of the office.
Research Conclusions
1
Focus
The users do not want to analyze all activities of the Customer Service Center remotely; they only want to know when something goes wrong.
2
KPI
The most important online indicator in a customer service center is the working load compared to the maximum load that can be handled.
3
When to push
KPIs can be quantified numerically, so a threshold for emergency notification can be set in advance.
4
Team Overview
When an intervention is needed, the manager may need to know what every agent is doing so she can adjust assignments.
Objectives (based on the research)
Notify managers when a problem arises
Necessary indications available at a glance
Useful data for quick, long-distance decision making
The Solution
We designed a thin application that includes only what is needed without any “background noise.”
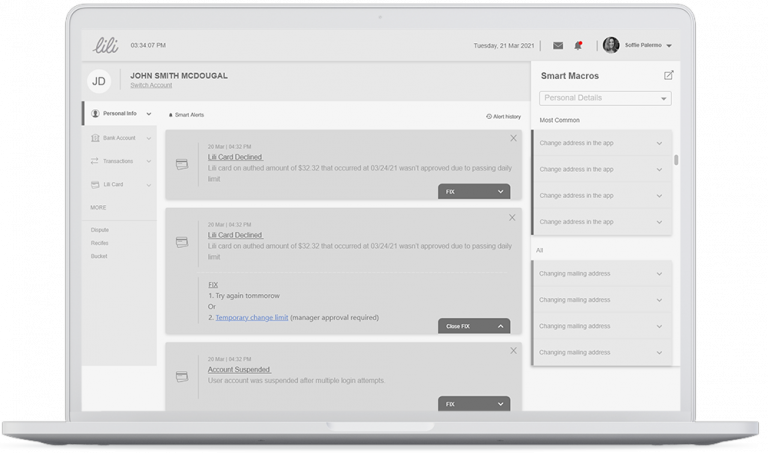
The most important feature is the customized smart alerts. Using this feature ensures that the Customer Service Center manager can remain calm even without having to look at the app frequently.
When she wants to, she can open the app and get notifications and important information within half a second. Now, she can quickly and easily ensure everything is functioning as it should.

Objectives become Key Features
Zoom In
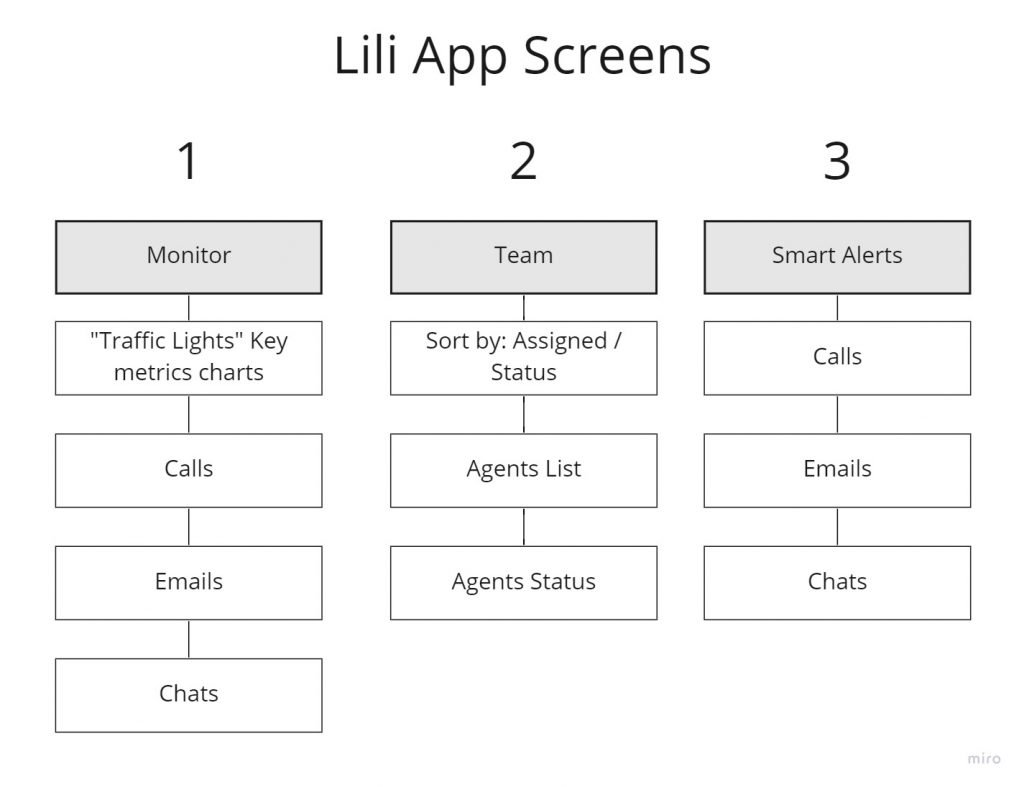
"Traffic Lights" Glance Indications
Positioned on the top of the main screen, the “Traffic Lights” Glance Indications give the user a quick status update of the working load at the Customer Service Center. The color red means the manager’s attention may be needed.
Smart Alerts Settings
Smart push alerts can be customized for key metrics.
Team Assignments Overview
When an assignment needs to be changed, the manager needs to see who is doing what.
If an agent exceeds the allotted time, a red mark will appear.
Key Metrics
Key Metrics indicating the working load.
Let's Work Together
Contact me at itaiakn@gmail.com
See more


